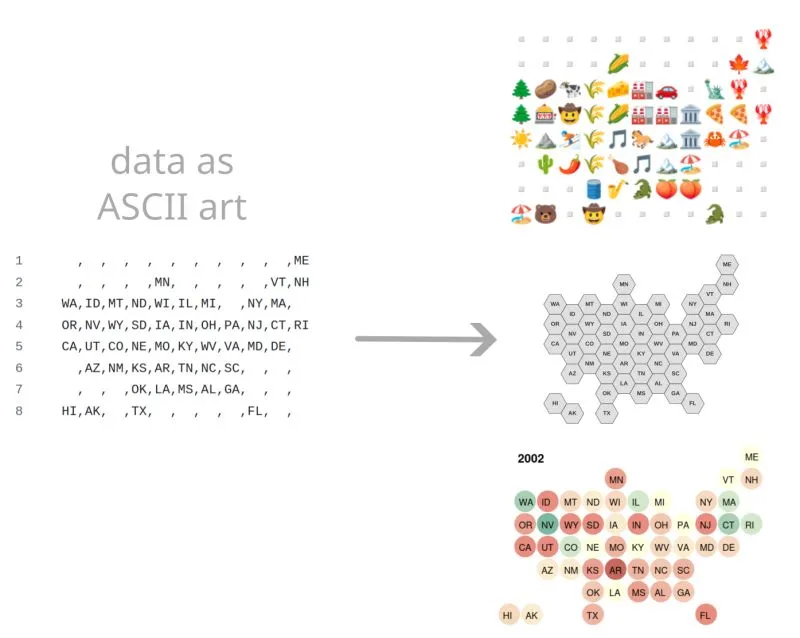
Works portfolio

Grid cartograms

Work

This work was realized for my own interests and curiosity .

2018 2025 Bolivia Data Visualization Library Observable Writing

In 2018, I was fascinated by grid cartograms, and I wrote a review about them in an Observable notebook. It has been one of the most popular among my notebooks.

Review about grid cartograms

In 2025, I took another look at them, before the general elections in Bolivia.

Cartogram of Bolivia, where the size of each department is proportional to the number of representatives
Cartogram of Bolivia, where the size of each department is proportional to the number of deputies

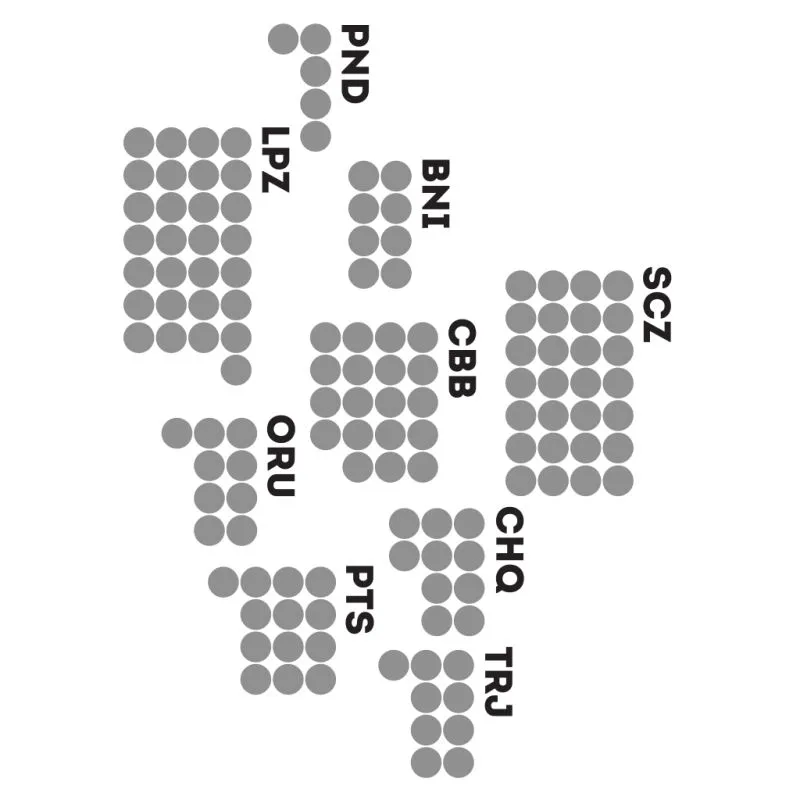
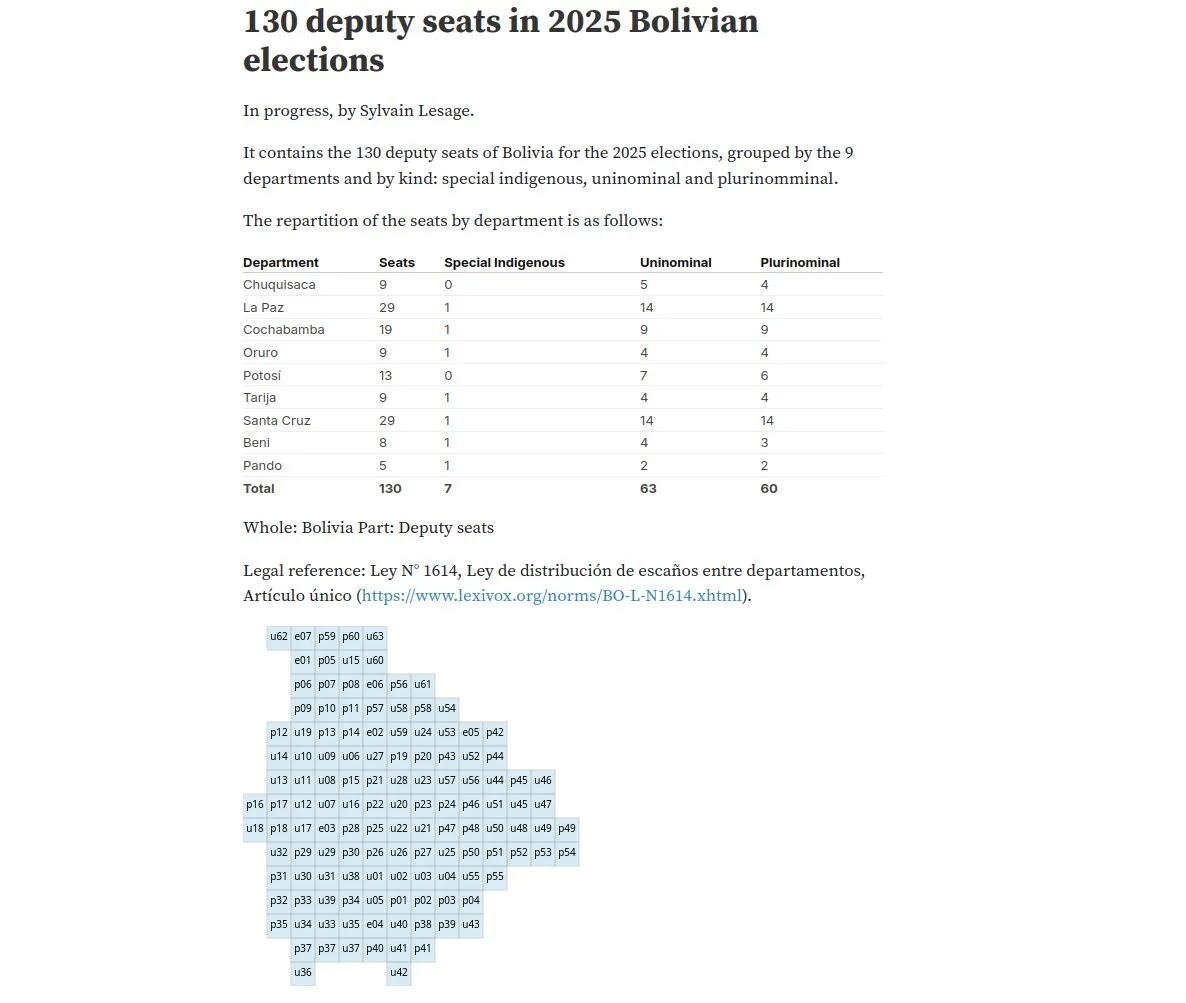
I then decided to publish a repository on GitHub, named data-grid-cartograms, to share grid cartograms in a data format. It contains grid cartograms for France, the US, Bolivia, Italy, Africa and the world.

Data format for cartograms