< Tags
Tag
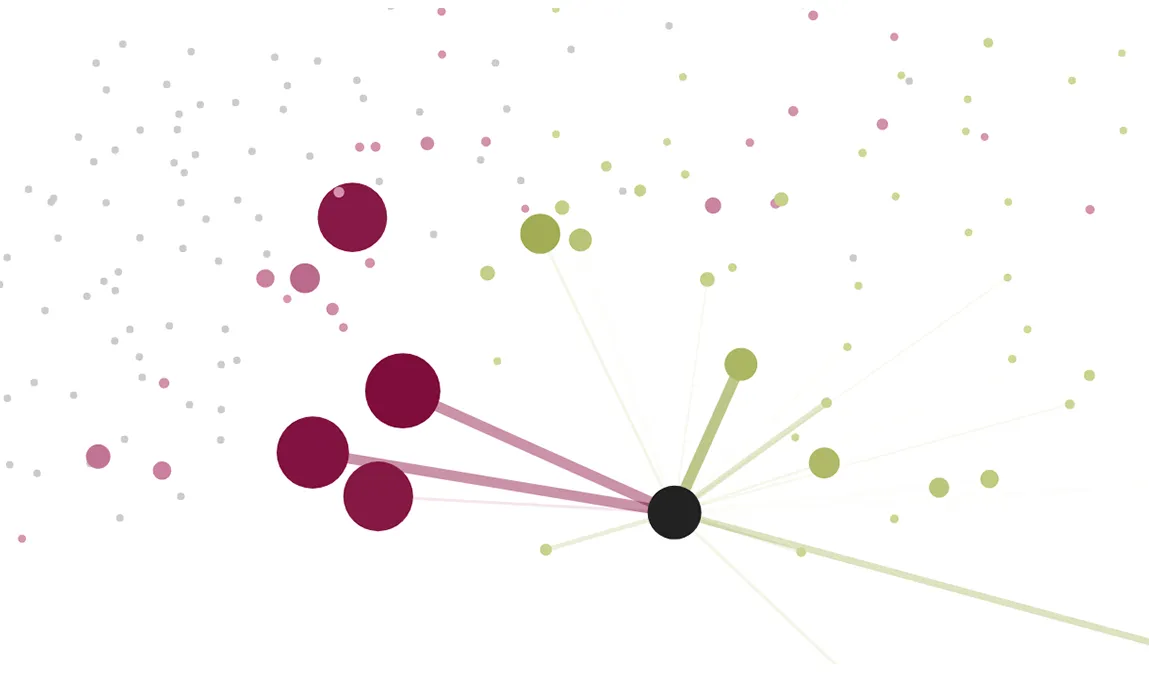
Zoomable graph of citations between journals
Moritz Stefaner 2018 D3.js JavaScript Network diagram SVG
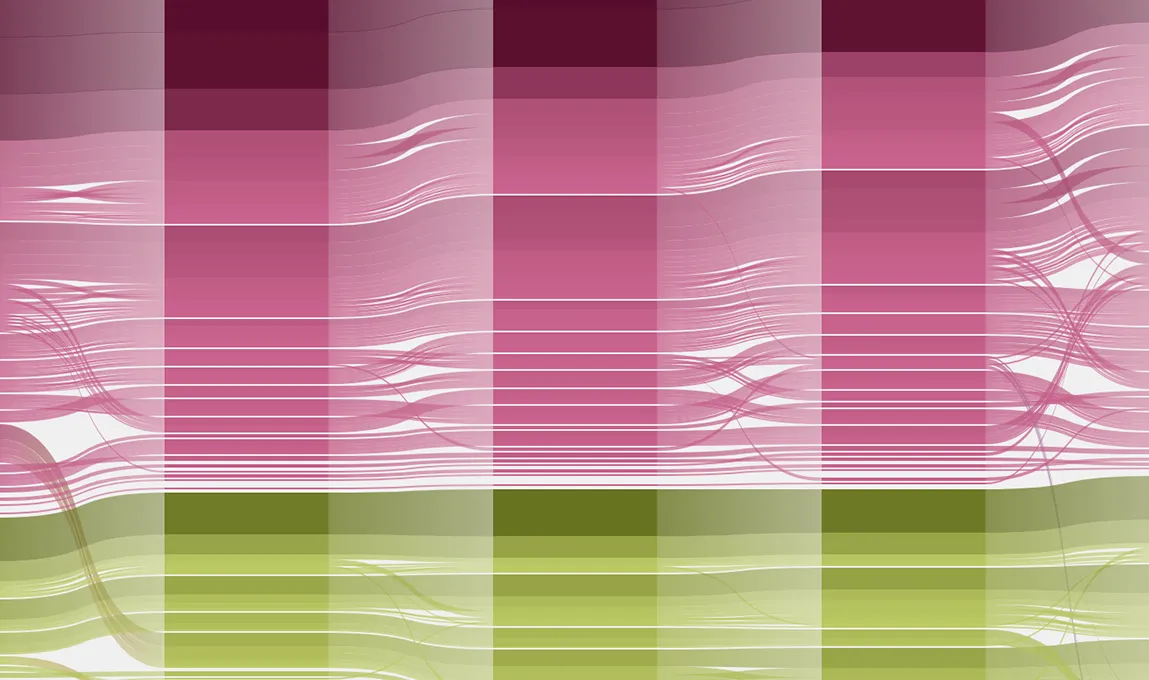
Evolution of Eigenfactor scores of journals
Moritz Stefaner 2018 D3.js JavaScript Parallel sets SVG
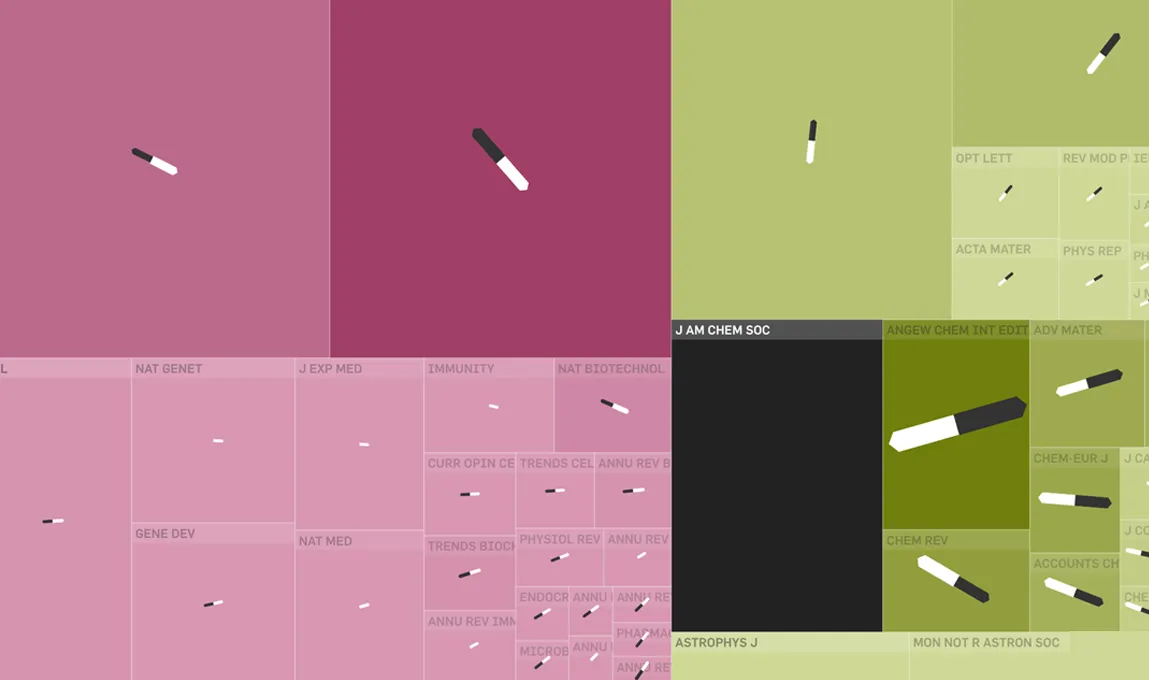
Hierarchical map of scientific fields
Moritz Stefaner 2018 D3.js JavaScript SVG Treemap
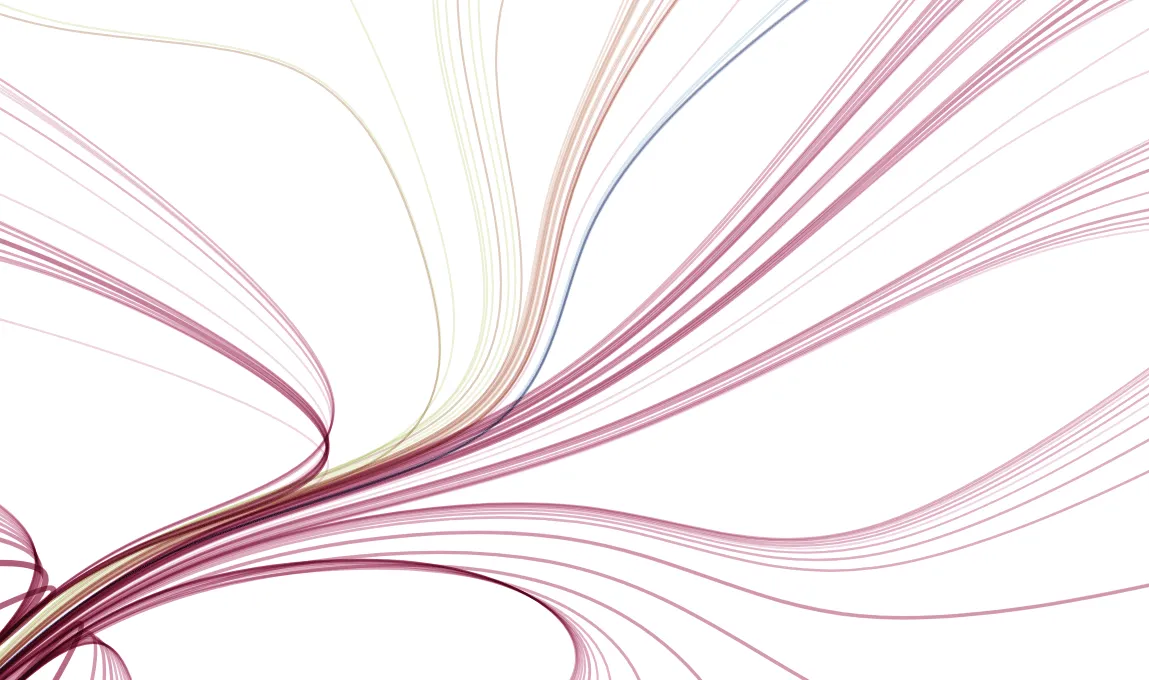
Network of scientific citations
Moritz Stefaner 2018 Chord diagram D3.js JavaScript SVG
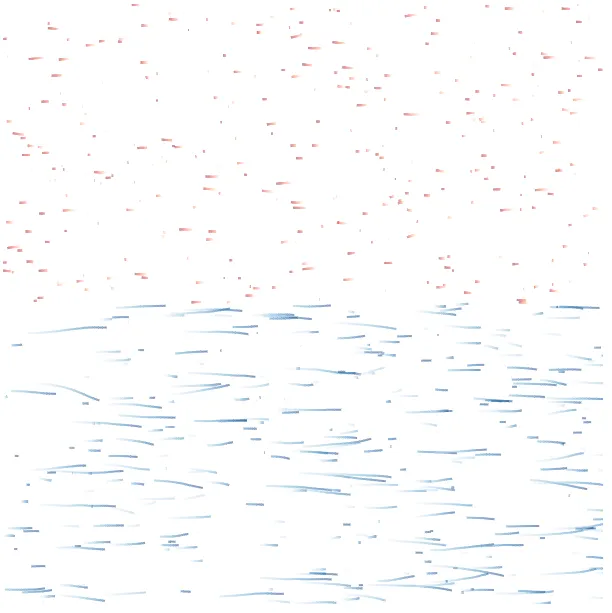
Wind effect with particles flowing to the right or left
Personal projects 2024 Context 2D D3.js JavaScript Observable
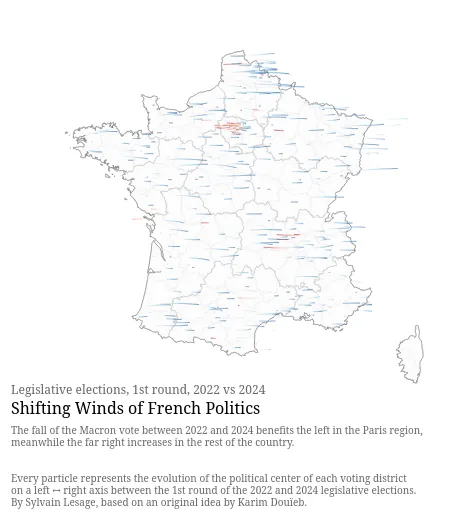
Shifting Winds of French Politics: Mapping Right and Left Shifts in the 2024 vs. 2022 Elections.
Personal projects 2024 Context 2D D3.js Elections JavaScript Observable