< Tags
JavaScript
Tag
Blog posts
Works

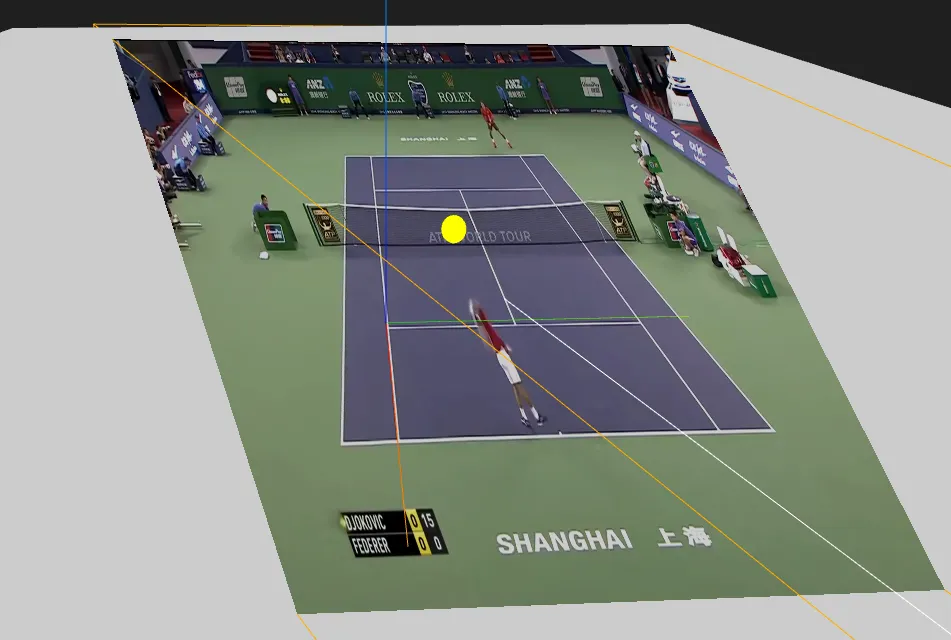
Video of a tennis match, projected on a 3D scene and synchronized with the ball tracking data

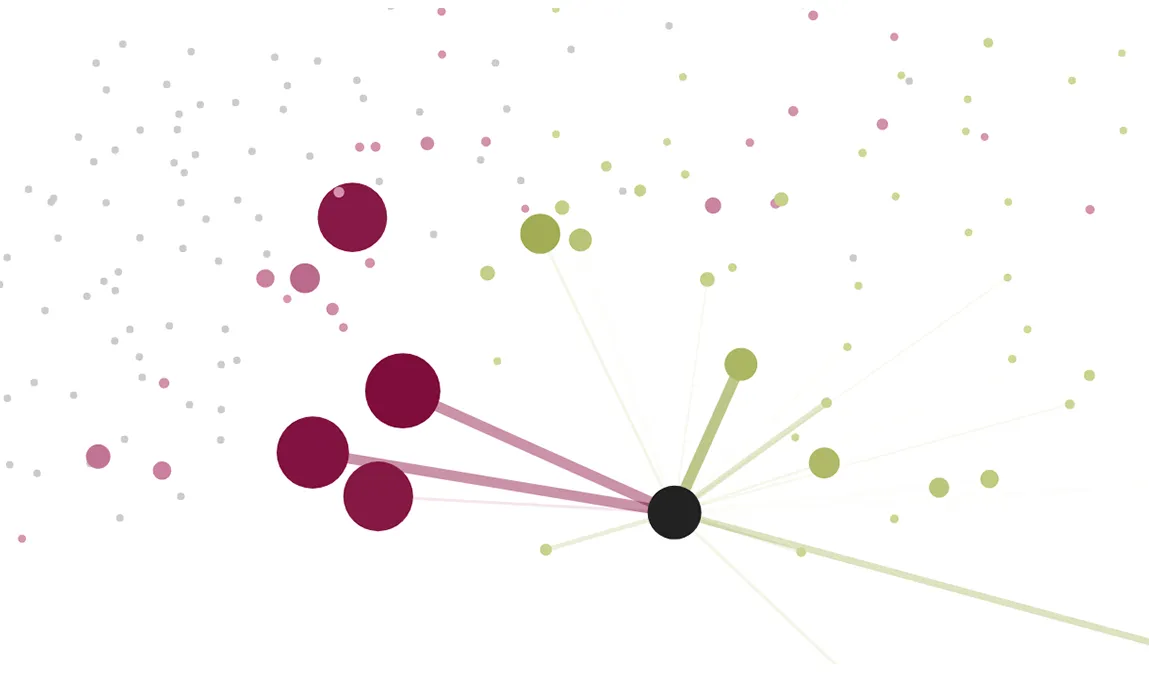
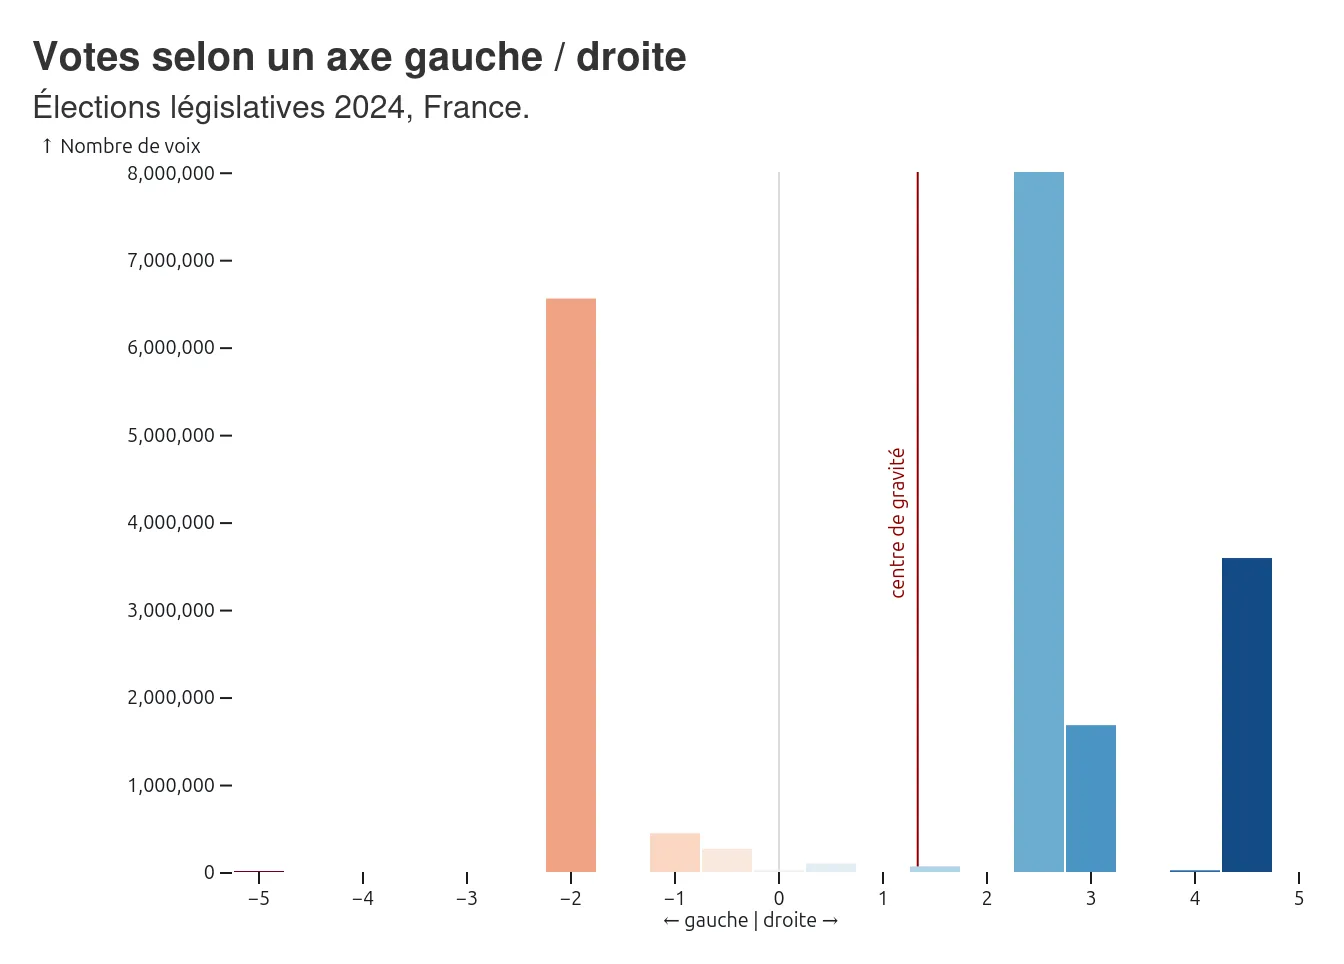
Distribution of votes along the left-right scale in France, 2024
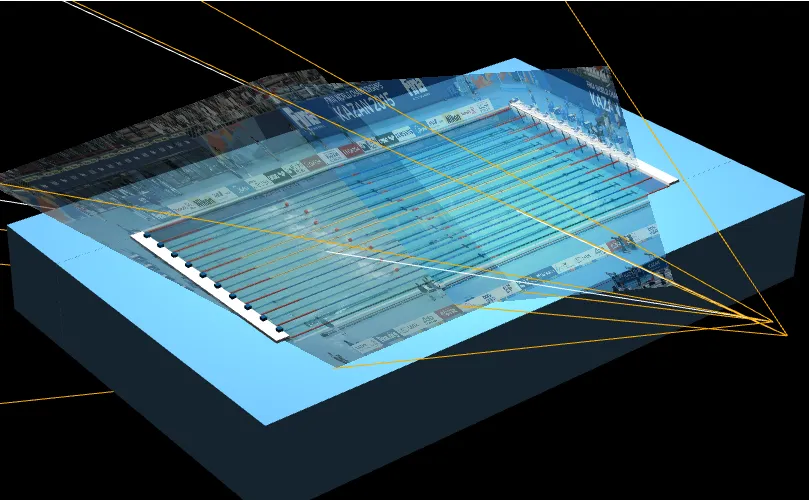
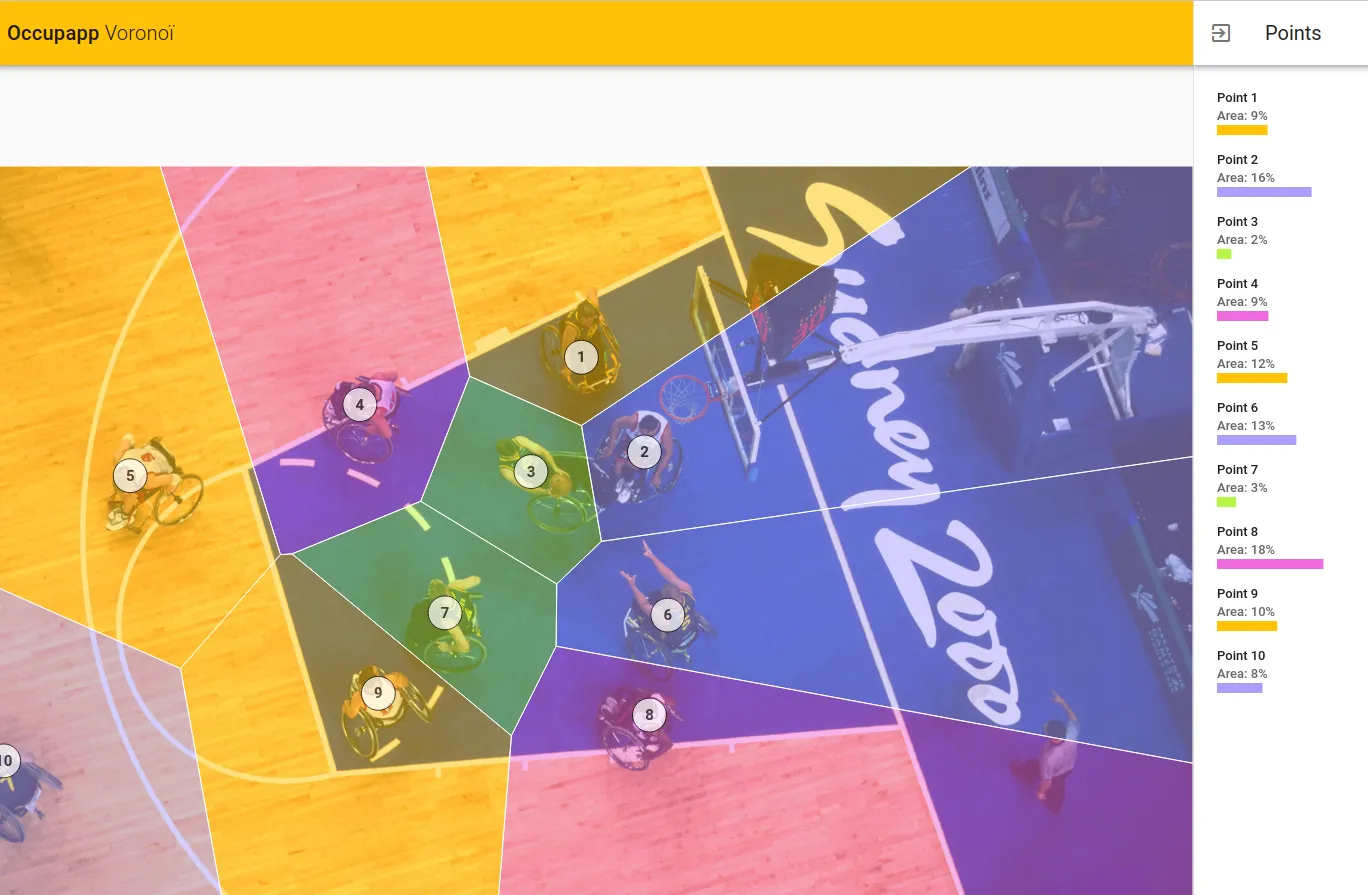
Synchronized videos of a swimming race, projected on a 3D scene
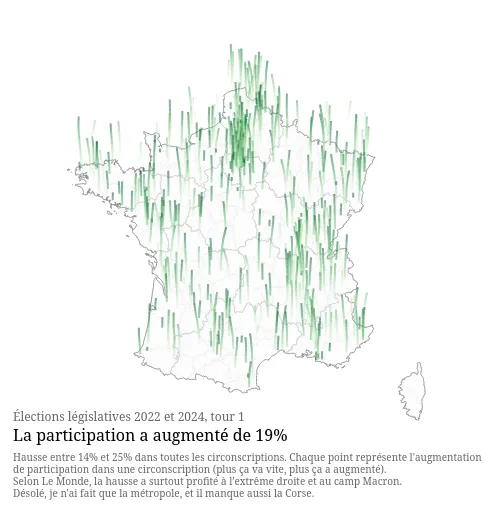
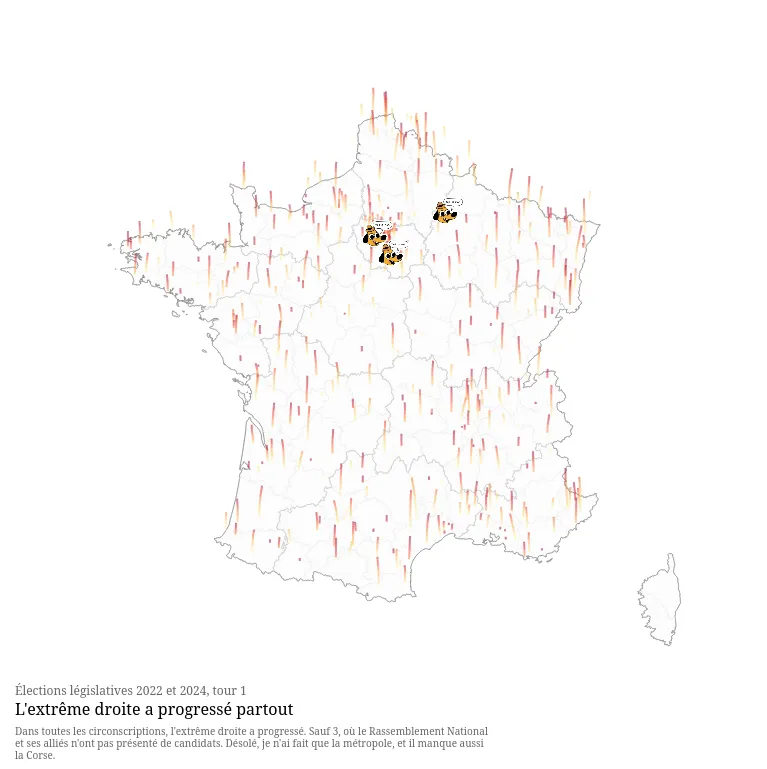
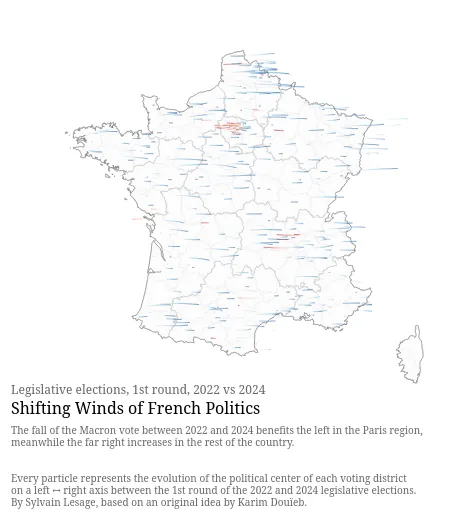
Shifting Winds of French Politics: Mapping Right and Left Shifts in the 2024 vs. 2022 Elections.