Sport visualization
Work
This work was realized for LIRIS .
Space partition
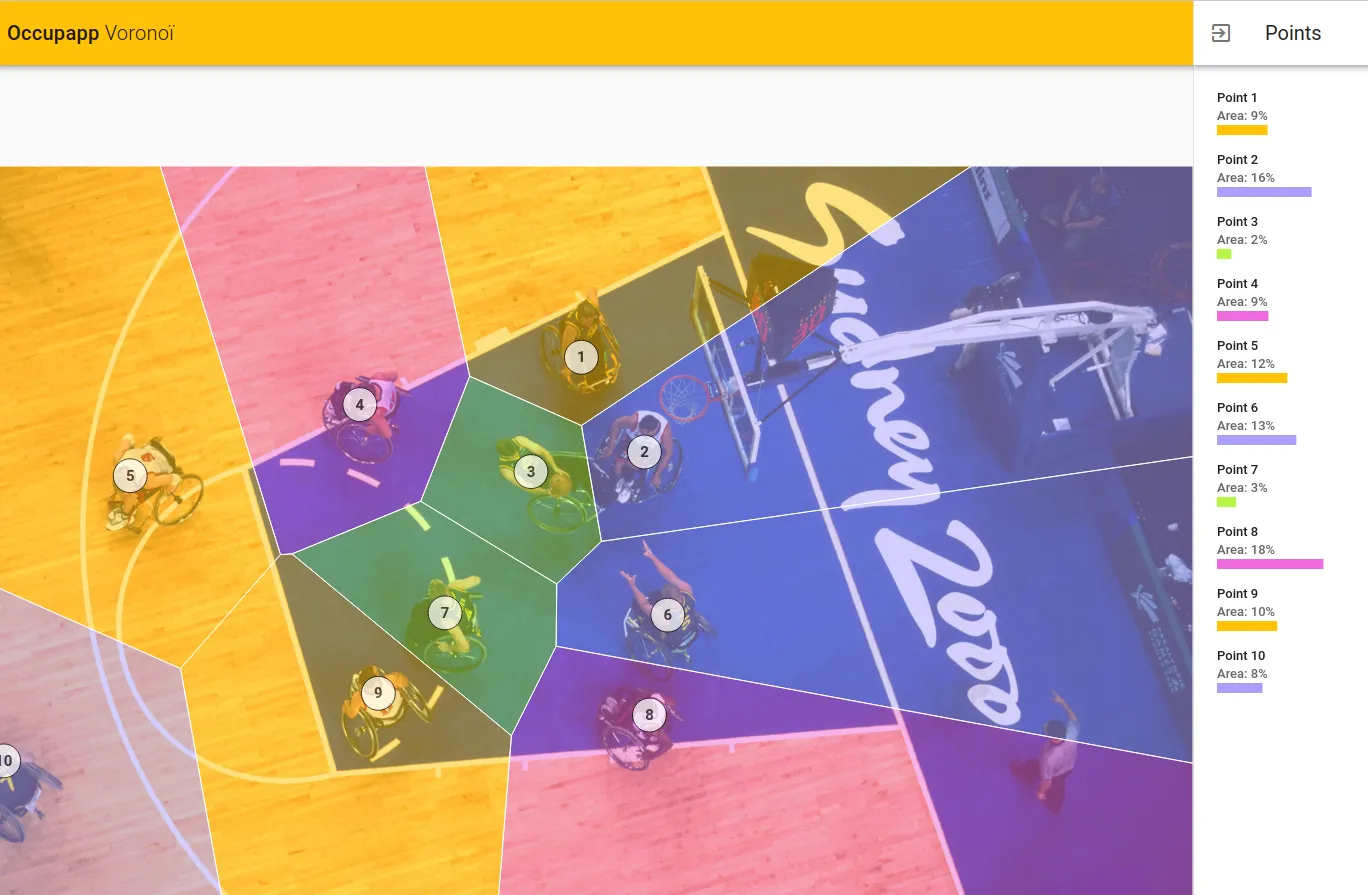
In 2020, we worked on a project to visualize the space partition of a field, based on the positions of the players. We used a Voronoi diagram to partition the space.
I built a small app in Vue.js to partition the space using the Voronoi algorithm (from D3.js). The app is deployed at https://occupapp.vercel.app/ and the code is available on GitHub: https://github.com/LyonDataViz/occupapp.
A collaborative version of the app was also developed, using WebSocket to synchronize the state between multiple clients. The backend is not deployed anymore, but the code is available on GitHub: https://github.com/LyonDataViz/socket-server.
Videos and 3D
Late 2020 and early 2021, we worked on visualizing sports data in 3D, based on videos of the players.
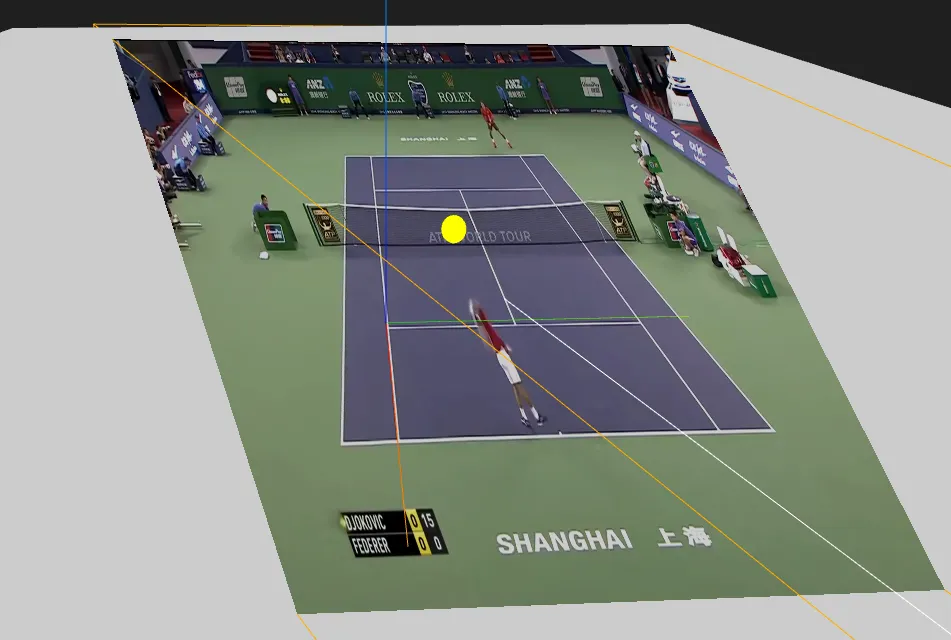
A first example was to project a video of a tennis match on a 3D scene, and to overlay the position of the ball.
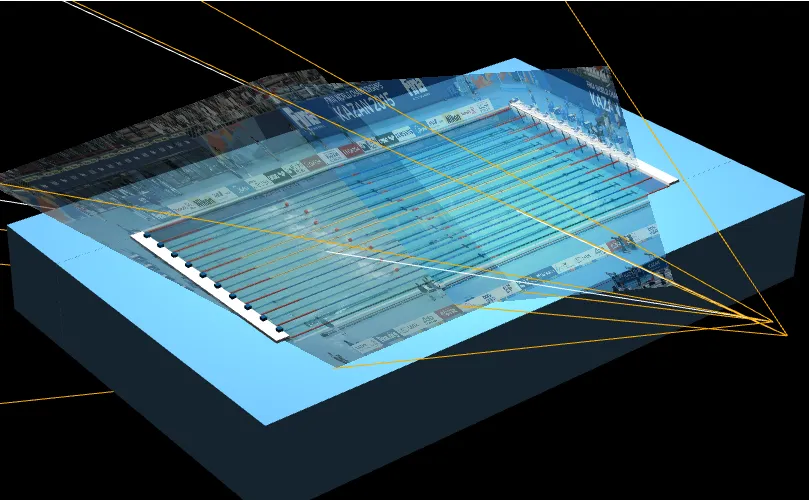
Another application was on swimming, where we synchronized two videos and the swimmers positions in a 3D scene of the swimming pool.